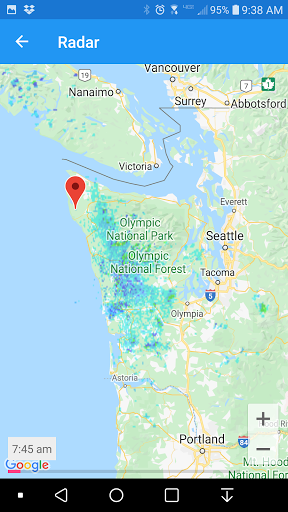
Optimized radar display
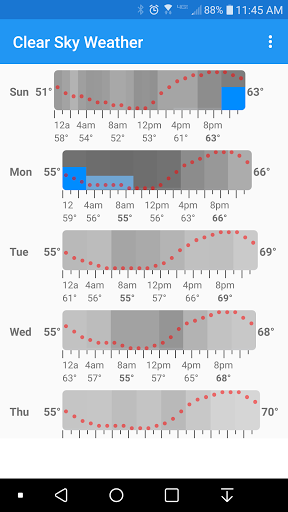
Shows the cloudiness, rain chance and temperatures in an hourly graph for each day.
Cloudiness shows as the darkness of the gray background. Rain chance shows as a vertical bar. The taller the bar, the higher the chance of rain. The darker the rain bar, the more rainfall is predicted.
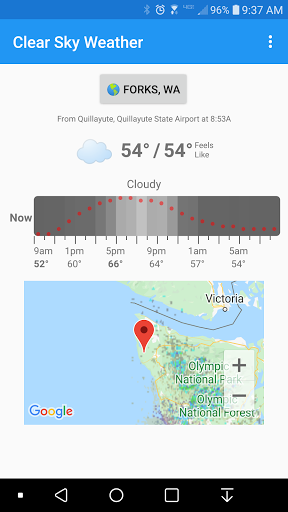
Radar is also supported. Tap the current radar image to see an animated map.
Uses NWS data.